Monocle 3 Is Now Available on Vecura
This update enables single-cell genomics researchers to perform clustering, trajectory inference, differential expression analysis, and label transfer on scRNA-seq data through a guided workflow inside Vecura, without setting up complex R-based computational infrastructure.
What is Monocle 3?
Monocle 3 is a widely used R package developed by the Trapnell lab for the analysis of single-cell RNA sequencing (scRNA-seq) data. It provides a comprehensive toolkit for discovering cell populations, tracing developmental trajectories, identifying marker genes, and testing how gene expression changes across experimental conditions or along pseudotime.
It helps users move from a raw gene-by-cell count matrix to a biologically interpretable picture of cellular dynamics — identifying which cell types exist, how they are connected through developmental lineages, and which genes drive transitions between states. It is especially useful for studying processes such as embryonic development, cell differentiation, tissue regeneration, and cellular responses to stimuli, where cells are captured at different stages of a continuous biological process.
What can users do with Monocle 3 on Vecura?
With Monocle 3 on Vecura, users can:
-
Process and cluster single-cell transcriptomic data — normalize raw counts, reduce dimensionality with PCA or LSI, correct batch effects using mutual nearest neighbour alignment, embed cells with UMAP, and group them into clusters and statistically separated partitions using Leiden or Louvain community detection.
-
Reconstruct developmental trajectories and order cells in pseudotime — learn principal graphs through the cell embedding using reversed graph embedding (SimplePPT), define trajectory roots based on metadata or specific cells, and assign each cell a pseudotime value that reflects its progression along a lineage.
-
Identify marker genes and perform differential expression analysis — rank genes by Jensen-Shannon specificity to find cluster markers, test gene significance with logistic regression, and fit per-gene generalized linear models (quasi-Poisson, negative binomial, zero-inflated, and other families) to detect genes that vary with any cell-level covariate such as treatment, batch, time, or pseudotime.
-
Transfer cell-type annotations from an annotated reference to a new query dataset — project a query dataset into a reference PCA/UMAP space, assign labels by majority vote of nearest reference cells, and fill unassigned cells from their labelled query neighbours — enabling rapid annotation of new experiments against existing atlases.
What the output means
The output provides a combination of structured tables, visualizations, and processed data objects:
-
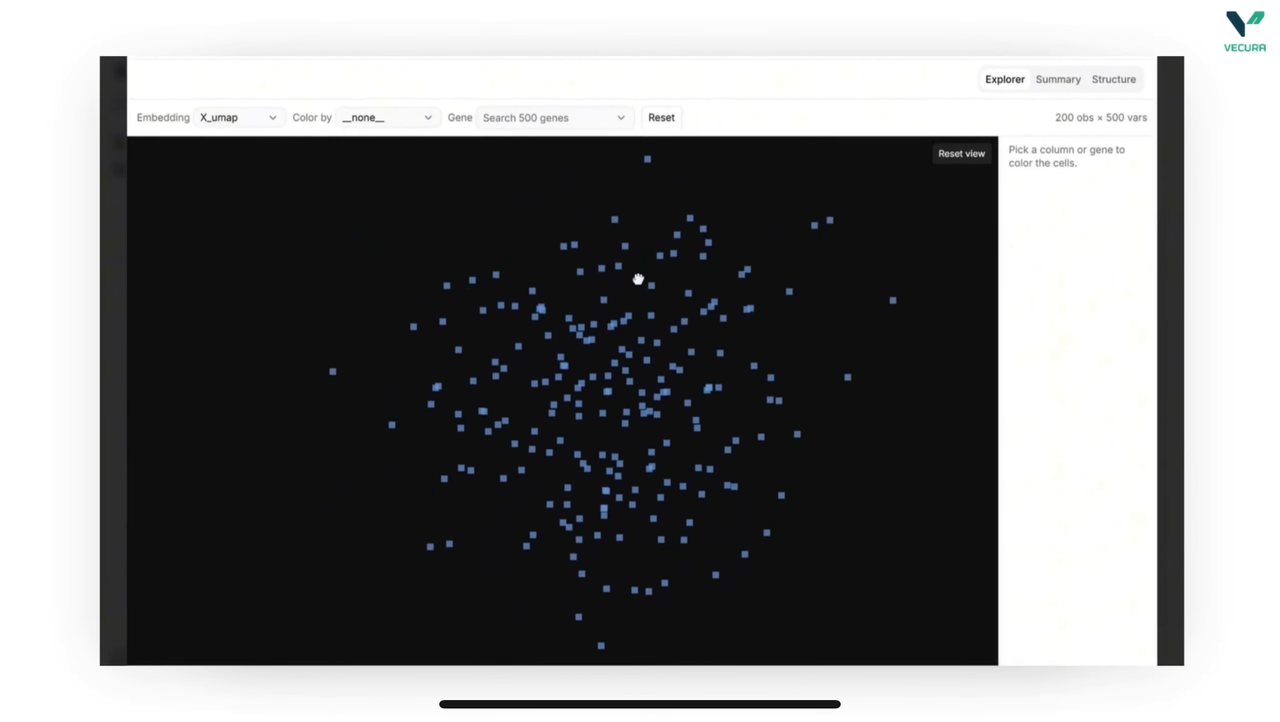
Cluster and trajectory plots (UMAP-based PNG images) showing cell groupings, principal graph overlays, branch points, and pseudotime gradients.
-
Marker gene tables ranking the most specific genes per cluster or cell group, with specificity scores, logistic regression statistics, and q-values.
-
Pseudotime tables assigning each cell its position along the inferred trajectory, with unreachable cells flagged.
-
Differential expression coefficient tables reporting per-gene estimates, Wald test statistics, q-values, and normalized effect sizes for each model term — enabling researchers to identify genes that respond significantly to experimental covariates.
-
Graph autocorrelation tables and gene module assignments identifying genes whose expression is spatially structured across the embedding or along the trajectory, grouped into co-expressed modules.
-
Label transfer tables showing the assigned cell-type labels for query cells, along with confidence metrics and co-embedding visualizations.
-
Processed cell_data_set objects (.rds files) that can be reused as inputs for downstream analyses or as references for future label transfer.
This output should be used to support scientific decision making. It does not replace experimental validation.
Why this matters
Single-cell RNA sequencing has transformed our understanding of cellular heterogeneity, revealing that tissues are composed of far more diverse cell states than previously appreciated. However, analysing scRNA-seq data requires navigating a complex computational pipeline — from quality control and normalization through dimensionality reduction, clustering, trajectory inference, and statistical testing. Monocle 3 has become one of the standard tools in this space, used in landmark studies including the mammalian organogenesis atlas by Cao et al. (Nature, 2019), which mapped the transcriptional landscape of developing mouse organs at single-cell resolution.
By making Monocle 3 available on Vecura, we remove the barriers of R environment setup, dependency management, and pipeline scripting. Researchers can now focus on the biological questions — which lineages are present, what genes define them, how do cells transition between states — while Vecura handles the computational infrastructure. The guided workflow supports the full analytical arc from raw counts to annotated, trajectory-ordered datasets, including the increasingly important task of projecting new data onto existing reference atlases for consistent cell-type labelling across experiments.
-
Developed by: Cole Trapnell Lab (University of Washington)
-
Source: GitHub Repository · Documentation
-
Reference: Cao, J. et al. The single-cell transcriptional landscape of mammalian organogenesis. Nature 566, 496–502 (2019). · Qiu, X. et al. Reversed graph embedding resolves complex single-cell trajectories. Nature Methods 14, 979–982 (2017).
在 Vecura 上试用 Monocle 3
打开模型工作区,用您自己的输入开始评估